Impressions Without Clicks: Understanding the Data Gap
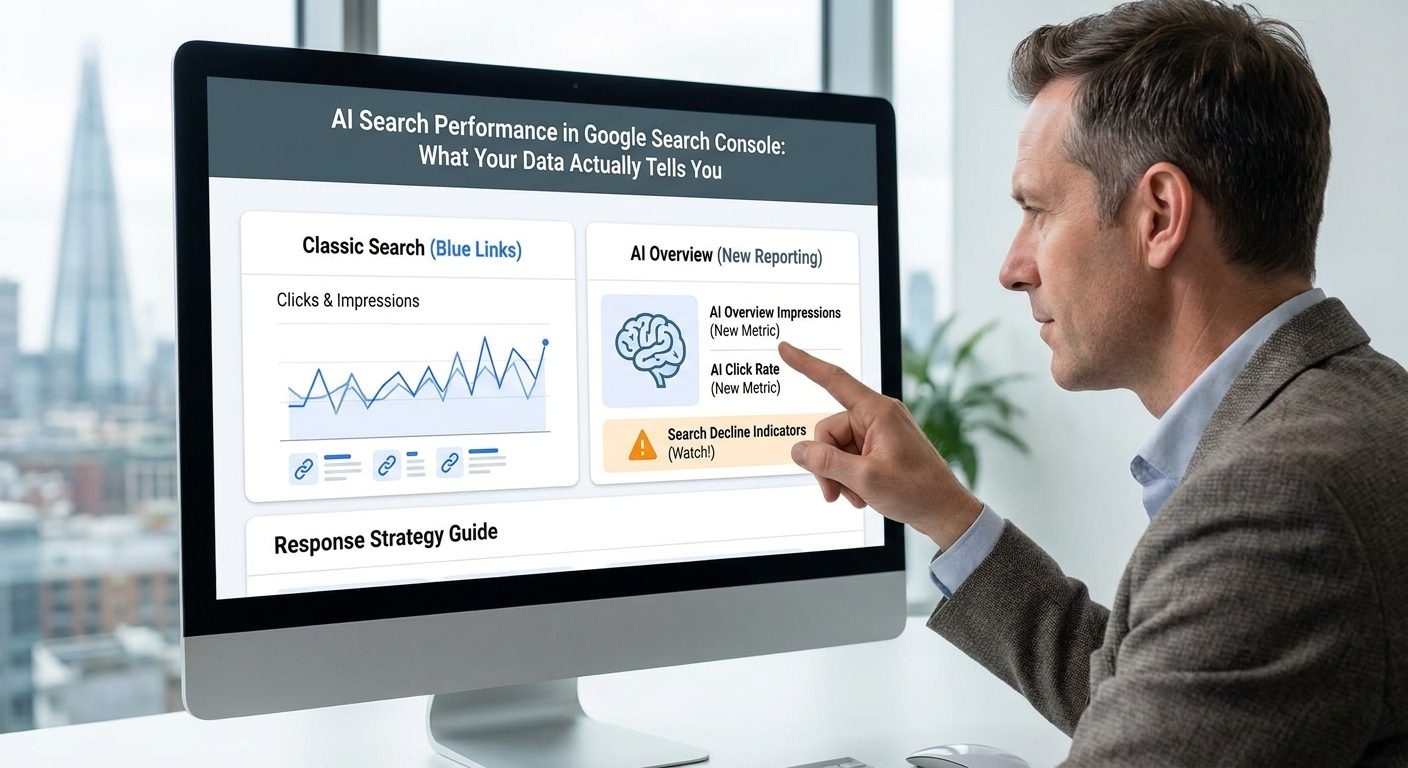
The new AI performance report in Search Console shows you one thing clearly: impressions. What it does not show you yet is clicks. That means you can see how often your pages were pulled into an AI Overview, AI Mode response, or a generative Discover feature, but you cannot see how many users followed a link from that feature back to your site. Google has confirmed that click data for AI features is on the roadmap, but no release date has been given.
It is worth being precise about what an impression actually means in this context. When your page records an AI Overview impression, it means your content was cited or referenced as part of a generated answer. It does not mean your brand name appeared prominently, or that the user noticed your site, or that they had any idea your content was the source. The AI may have drawn on your page to construct a paragraph and never surfaced your domain at all in a way the user registered.

This creates a specific analytical problem. High impressions in AI Overviews combined with falling organic clicks in the standard Performance report is a strong signal that AI is consuming traffic that once came directly to your site. Your content is doing the work of earning a citation, but the reward, a visitor landing on your page, is no longer following automatically.
The practical way to spot this pattern is straightforward. Pull your AI impressions trend line and your standard Performance report click trend line across the same date range, ideally the last 90 days. If those two lines are moving in opposite directions, or if the gap between them is widening over time, that is your key warning sign. You are gaining AI visibility at the direct expense of actual visits.
To do this in Search Console: open the Performance report, click the "Search type" dropdown at the top and select "AI Overviews" (listed as a separate search type from the main Web report). Export the data to a spreadsheet, then switch the dropdown back to "Web" and export the same date range again. Paste both exports side by side in a single sheet and create a column that subtracts standard clicks from AI impressions. Sort descending. The pages at the top of that sorted list are the ones bleeding visibility without returning visits.
Neil Patel's analysis of the GSC rollout describes impressions without clicks as an incomplete picture but a meaningful start. That framing is accurate. However, it should not be used as a reason to sit on your hands until click data arrives. The impression data available right now is enough to identify which pages are being absorbed into AI answers and which query areas are most at risk. Building your measurement framework around impressions now means you will be ready to layer in click data the moment Google ships it, rather than starting from scratch at that point.
How to Access the AI Performance Report in Search Console
Before you can track any of the metrics described in this article, you need to confirm that the report is visible in your Search Console account. Google has been rolling it out gradually, and not every property had access at launch in May 2025. Here is exactly where to look and what to do if you cannot find it yet.
Log in to Search Console and select your property. In the left-hand navigation, click "Search results" under the Performance section. At the very top of the report you will see a row of filter pills: Web, Image, Video, News, Discover, and Google Maps. If the rollout has reached your account, you will also see a pill labelled "AI Overviews" or "AI Search" depending on your interface version. Click it. The chart and table below will refresh to show impression data specifically from AI-generated responses.
If you do not see that pill, check under the "Search type" dropdown instead. Google has placed the filter in slightly different locations across different interface versions. If neither location shows an AI option, your property has not yet received the rollout. The practical workaround is to set a calendar reminder to check again in 30 days. There is no manual opt-in process and no way to accelerate the rollout for a specific property.
One configuration point that trips people up: make sure your property is verified as a domain property rather than a URL prefix property if you have not already done so. Domain properties aggregate data across all subdomains and HTTP or HTTPS variants, which gives you a complete picture. A URL prefix property set to https://www.yoursite.co.uk will miss any AI impression data attributable to the non-www version or any subdomain you may have, such as a blog or a shop on a separate subdomain. The difference in impression count between a partial and a complete property can be significant enough to make your trend analysis misleading.
Once you have confirmed access, set the date range to the maximum available (typically 16 months). This is important because AI Overviews were expanding quietly throughout 2024 before the reporting landed. Having the longest possible historical baseline means you can see not just whether AI impressions are rising now, but how long that rise has been underway before you had the data to notice it.
Four Metrics to Monitor Every Month Once You Have Access
Once you can access the AI performance report, the temptation is to stare at the total impression number and draw a conclusion from it. Resist that. The headline figure tells you very little on its own. What matters is four specific cuts of the data, tracked consistently each month so that you can spot trends before they do measurable damage to your traffic.
AI impression volume by page
The first thing to do is break the report down by page, not by query. You want to know which specific URLs on your site are being pulled into AI answers. A page with rising AI impressions and simultaneously falling standard clicks is in a particular kind of trouble: it is actively feeding the AI feature that is replacing its own traffic. Those pages are your highest priority for strategic review.
Look for pages where AI impressions have grown by more than 20 percent month on month while standard clicks for the same URL have stayed flat or dropped. That combination is not a coincidence. It reflects the AI feature expanding coverage of that topic area, using your content as a source, and satisfying user intent without sending anyone to your site.
As a concrete example: imagine you run a domestic cleaning business in Brighton and you have an article titled "How often should you clean your oven?" That page has historically earned 200 clicks a month from people researching the topic who then saw your professional cleaning service at the bottom of the page. Under the new reporting, you might see that page recording 1,400 AI impressions in September but only 60 standard clicks. The article is being used to answer the question inside Google. The reader gets their answer and closes the tab. Your cleaning service enquiry form never loads.
AI impression share by query
Switch the filter from page to query. You are looking for search terms where you rank well in standard blue-link results and also appear in AI Overview impressions. These are your most vulnerable traffic sources, because the same query that once reliably sent a user to your page now has an AI answer sitting above your result.
Pay particular attention to queries where you hold a position one or two in standard search. Historically those positions delivered strong click-through rates. If those same queries now show significant AI impressions, your effective click-through rate on that keyword has almost certainly dropped, even if your ranking has not changed at all.
The query-level view is also where you can begin to distinguish between two very different situations. A query like "what is a party wall agreement" is deeply informational and near-certain to be fully satisfied by an AI Overview. A query like "party wall surveyor Chichester" is transactional and local, and AI Overviews are substantially less likely to intercept it because the user intent is to find a specific business, not to receive an explanation. If your AI impressions are concentrated on the first type of query and your standard clicks are concentrated on the second type, your business model may be more insulated than the headline impression numbers suggest. If it is the reverse, you have a problem worth acting on immediately.
Week-on-week AI impression trend
Look at your AI impressions in weekly segments rather than aggregating to a monthly view. A sudden spike in AI impressions, doubling or tripling in a single week, often corresponds to Google expanding an AI Overview topic category. Catching this early is genuinely useful. It tells you which content areas are being restructured by AI before the traffic drop confirms it in your standard Performance report, sometimes weeks later.
If you spot a spike, cross-reference it with the pages driving the increase. Then check whether those pages saw a corresponding dip in standard clicks that same week or in the two weeks following. That timing relationship is evidence, not proof, but it gives you a basis for prioritising your response.
The lag between an AI impressions spike and the resulting click drop is typically between one and three weeks in patterns observed across multiple sites since the report launched. That gap exists partly because Google rolls out AI Overview expansions incrementally by geography and user segment before applying them universally. If you catch a spike in week one, you may have a short window to decide whether to update the page, restructure it, or redirect the call to action before the full traffic impact hits. A weekly monitoring habit, which takes roughly five minutes per session, is what makes that window usable rather than theoretical.
Discover AI impressions versus standard Discover performance
This one matters specifically for publishers, lifestyle brands, and e-commerce sites that rely on Google Discover for a meaningful share of their traffic. The new report includes a separate Discover AI impressions view. If those impressions are growing while your standard Discover clicks are flat or falling, your content is being consumed by the generative Discover feed without translating into visits.
Discover traffic has always been harder to influence deliberately than search traffic. But the introduction of generative features into the Discover feed adds a new layer of interception. A rising Discover AI impression count alongside static Discover click numbers is the same zero-click cannibalisation problem seen in search, just in a different surface.
Build a simple monthly tracking sheet
None of this needs a sophisticated dashboard to start with. Set up a spreadsheet with four columns: date, total AI Search impressions, total standard Search clicks, and the ratio between the two (AI impressions divided by standard clicks). Update it on the first working day of each month using data from the previous full month.
A rising ratio means AI is taking a larger share of your visibility without delivering proportional traffic. A ratio that was 3:1 in July and is 7:1 by October is telling you something real and actionable, even before click data exists to complete the picture. This simple sheet costs you about ten minutes a month and gives you a trend line you can show to a client, a colleague, or yourself when you are deciding where to focus effort next.
If you want to go one step further without adding significant complexity, add a fifth column: revenue or enquiries tracked via Google Analytics 4 for the same period. You are looking for whether the periods when your AI-to-click ratio spikes correspond to dips in enquiries. If they do, you have a chain of evidence that runs from AI impression data all the way through to business impact, and that chain is what justifies investing time or budget in a response.
What Declining Organic Clicks Alongside Rising AI Impressions Actually Means
There is a specific name for the pattern where your AI impressions climb while your organic clicks fall. It is called zero-click cannibalisation. Your content is good enough to be cited by Google's AI, which is a form of editorial endorsement, but the AI answer is complete enough that the user never needs to visit your site to get what they came for. You do the work of earning the citation; someone else gets the benefit of the satisfied user.
This pattern hits informational content hardest. How-to guides, FAQs, explainer articles, and definition pages are the formats most likely to be fully absorbed into an AI Overview, because they are written to answer a question directly and completely. That directness, which made them valuable for SEO for years, now makes them ideal raw material for an AI that wants to answer the same question without sending anyone anywhere.
For a trades business, a plumber, an electrician, a roofer, the practical implication is quite specific. An article titled something like "how much does a boiler service cost in the UK" may now generate almost no site visits even if it ranks well in standard results. The AI reads the price range from your page, quotes it in the Overview, and the user moves on satisfied. They never clicked. They may never even have noticed your business name.
The commercial impact depends entirely on what that informational article was doing in your funnel. If it existed purely to build brand awareness, losing its traffic is an annoyance. If it was the primary entry point for users who then explored your service pages and submitted an enquiry, losing its traffic is a revenue problem. Those are two very different situations requiring different responses, and the AI impressions data helps you identify which scenario applies to each affected page.
A practical threshold for flagging content as at-risk: any page showing more than 500 AI impressions per month alongside fewer than 50 standard clicks for the same query set deserves a strategic review. That ratio, roughly ten AI impressions for every single click, suggests the content is working hard as an AI source while generating almost no direct traffic. You can find this by cross-referencing the page-level AI impression data with the same URL's performance in the standard report filtered to its relevant queries.
The honest part of this analysis is the hardest to say: not all of this traffic loss is recoverable through content changes alone. Some of it reflects a structural shift in how Google handles certain query types. Broad informational queries, especially those with a clear factual answer, are increasingly owned by AI Overviews regardless of how well any individual piece of content is written. The productive response in those cases is not to rewrite the article a fourth time hoping for a different outcome. It is to redirect effort toward query types where AI Overviews are less dominant, typically transactional queries, local queries, and queries that require recent or highly specific information that AI is less equipped to synthesise confidently.
How to Respond Strategically to the Patterns You Find
Identifying the problem is only useful if it leads to a decision. The data from Search Console points in different directions depending on which pattern you have found, and the wrong response to one pattern can actively make things worse if applied to the wrong situation.
When informational pages are losing clicks to AI Overviews
The instinct for most business owners is to update the content. Add more detail, refresh the statistics, improve the structure. This is sometimes the right call, but it needs to be paired with a clearer commercial objective for the page. A page that answers "how much does a loft conversion cost" is never going to reclaim its pre-AI click volume through better writing alone, because the query has moved permanently into AI Overview territory. What you can do is restructure the page so that the element most likely to generate a business outcome sits at the top, before the informational content that the AI is harvesting.
Specifically: if your loft conversion cost article currently opens with a price range and a breakdown of variables, consider opening it instead with a lead capture element tied to a specific offer. Something like a free local quote, a downloadable specification checklist, or a callback request form. The users who do click through from standard results or from a cited source link in the AI Overview are higher-intent than the average browser. Serving them a conversion opportunity immediately, rather than making them scroll through the content the AI already gave them, makes better use of the reduced traffic the page is now generating.
When transactional or local queries show AI impressions rising
This is the scenario that deserves the most urgent attention, because it represents a structural threat to the query types that were previously considered safe. If queries like "electrician in Worthing" or "emergency plumber near me" are beginning to show meaningful AI impression volumes, it means Google is testing AI-generated local responses for those terms. The mitigation is different here because the problem is not about content quality; it is about entity clarity.
Google's AI needs to be confident in your business's identity, location, and service area to cite you in a local AI response. That confidence comes from consistency of your business name, address, and phone number across your Google Business Profile, your website, and every directory listing that references your business. A NAP inconsistency (where your address appears differently across Yell, Checkatrade, and your own contact page, for example) introduces ambiguity that makes it less likely the AI will confidently include you. Run your listings through a tool like BrightLocal or Whitespark to audit consistency before assuming the content is the problem.
When the cannibalisation is happening across a wide range of pages simultaneously
If you open the page-level AI impression report and find that 30 or 40 different URLs all show the same rising impressions, falling clicks pattern at the same time, you are probably looking at a site-level topic authority question rather than individual page problems. This happens when Google's AI has established your site as a reliable source for a broad subject area and is drawing on many of your pages systematically.
Counterintuitively, this is partly a sign of content strength. The AI is pulling from your site repeatedly because your content is trusted. The strategic response is to consolidate your calls to action across those pages, ensure your internal linking routes AI-sourced visitors efficiently toward your most commercially valuable pages, and consider adding content formats that are harder for AI to fully substitute. Long-form case studies with specific client outcomes, comparison tools, calculators with interactive inputs, and visual content with substantial original commentary are all formats that encourage a click because they cannot be reproduced adequately in a text-only AI response.
What to do about pages where the ratio has gone beyond repair
Some pages will show AI impression counts so high relative to their click volume that they are essentially functioning as AI training material rather than traffic-generating assets. A page with 3,000 AI impressions per month and 15 standard clicks is in this category. Before deciding to delete or redirect the page, check two things. First, is the page receiving any direct traffic or referral traffic that does not show up in the organic search data? Some pages earn links from other sites and generate visits that have nothing to do with Google. Second, does the page have any role in your site's internal link architecture that provides value to other pages regardless of its own traffic?
If the answer to both is no, and the page serves no conversion function and generates no useful traffic, the honest assessment is that maintaining and updating it is a poor use of your time. Redirecting it to a closely related service page preserves any link equity it has accumulated and removes a piece of content from your site that is working exclusively for Google's AI rather than for your business.
The Longer-Term Measurement Habit Worth Building Now
The businesses that will handle AI search disruption best are not necessarily the ones with the best content today. They are the ones that build a reliable measurement habit now, while the data is imperfect, so that they have a meaningful baseline when the data improves. Click data will arrive in Search Console at some point. When it does, the businesses that have been tracking AI impressions consistently for six or twelve months will be able to calculate an implied click-through rate for AI features from day one. Those that start only when the data feels complete will be months behind in their understanding of what is actually happening to their traffic.
The practical commitment is small. Fifteen minutes per month to update your tracking sheet. Five minutes per week to glance at AI impression trends in Search Console. One strategic review per quarter of your highest-AI-impression pages to decide whether any of them need restructuring. That is not a significant time investment relative to what it protects.
Connect your Search Console data to Google Analytics 4 via the native integration under Admin in GA4. Once connected, you can create an exploration report that segments organic search traffic by landing page and overlays it with your Search Console impression data in a single view. This is not a perfect substitute for AI-specific click data, but it lets you see whether the pages accumulating AI impressions are also the pages where your organic session quality is declining. If those pages are showing longer time-on-site and higher conversion rates than before (because lower-intent users are now filtered out by the AI Overview), the traffic loss is partially offset by a quality gain. If session quality on those pages is also declining, the situation is worse than the impression numbers alone suggest.
SEO has always required the patience to distinguish between what is changing permanently and what is cycling. Featured snippets caused very similar concerns about zero-click search when they launched and expanded through 2016 and 2017. Some traffic did not return. But the businesses that adjusted their content strategy and measurement approach during that period came out with a clearer understanding of which parts of their SEO were durable and which were not. AI Overviews are a larger and faster disruption than featured snippets, but the underlying analytical discipline is the same: measure precisely, distinguish the recoverable from the structural, and redirect effort where it will actually produce results.